This chapter describes how to set up the ESP environment on your system. The ESP environment includes the following components:
System serial number (Linux OS only)
Global configuration
Paging parameters
System/client parameters
System Group Manager (SGM) password parameters
| Note: The paging parameters are not included in the ESP 3.0 Web-based interface for the Linux OS. ESP 3.0 for the Linux OS does not include paging by default because SGI does not distribute the QPage application for the Linux OS. Paging capabilities are disabled when ESP 3.0 runs under the Linux OS. The ESP 3.0 graphical user interface for the Linux OS does not include the Paging menu. If you obtain the QPage application for the Linux OS from another source, you should manually install and configure it and then create an ESP action that calls the QPage application. |
You must set up the environmental components when you first configure ESP on a system. After that, modify specific parameters only when the corresponding environmental component changes.
The Linux System SN button (refer to Figure 4-1) is available only on systems that run the Linux OS. This button enables you to enter the serial number of a system that is running the Linux OS. (This button can appear if you are running ESP from SGI ProPack 2.3 or later; however, this button should not normally appear for ESP from SGI ProPack 2.4 and later, which can automatically detect the system serial number.)
The Linux System SN button appears under two conditions:
A local system is running the Linux OS, and ESP cannot detect the system serial number.
An SGM server has a subscribed client that is running the Linux OS and the system serial number was not detected or entered on the client before you subscribed the client to the SGM server.
| Note: You cannot set the Registration with SGI global configuration parameter to Enabled until you set the system serial number. |
On a local system, the Linux System SN button disappears after you enter the system serial number. On an SGM system, the Linux System SN button disappears after you enter the system serial number for each client system that does not have a system serial number set.
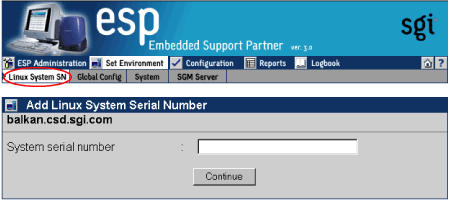
Perform the following procedure to set the system serial number in single system manager mode:
Click on the Set Environment button.
Click on the Linux System SN button.
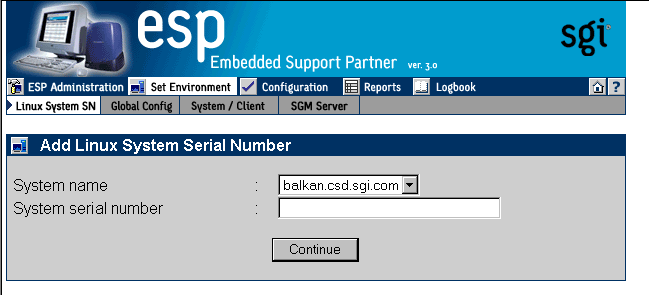
The interface displays the Add Linux System Serial Number window. (Refer to Figure 4-2.)
Enter the system serial number in the System serial number field.

Tip: To determine the system serial number, enter the cat /proc/sgi_sn/system_serial_number command. Click on the Continue button.
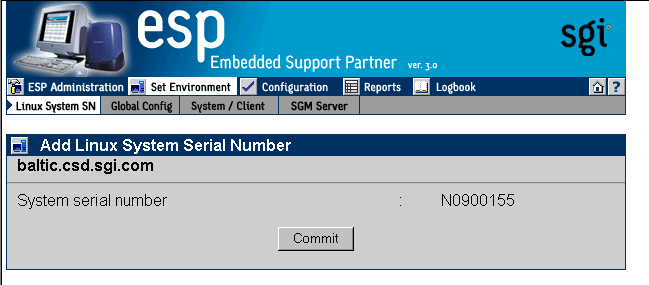
The interface displays a verification window. (Refer to Figure 4-3.)
Tip: Verify that you correctly entered the serial number before you click on the Commit button. You cannot change the serial number once it has been submitted. Click on the Commit button.
Perform the following procedure to set the system serial number in system group manager mode:
Click on the Set Environment button.
Click on the Linux System SN button.
The interface displays the Add Linux System Serial Number window.
One SGM Client without a Serial Number Set
If there is only one SGM client without a serial number, enter the system serial number in the System serial number field, and click on the Continue button. (Refer to Figure 4-4.) Then, log into ESP on the SGM client, and set the serial number on that system. You must set the serial number on the SGM server and the SGM client.
| Tip: Verify that you correctly entered the serial number before you click on the Commit button. You cannot change the serial number once it has been submitted. |
Multiple Clients without a Serial Number Set
If there is more than one SGM client without a serial number, choose the correct system from the pulldown menu, enter the system serial number in the System serial number field, and click on the Continue button. (Refer to Figure 4-5.) Then, log into ESP on the SGM client, and set the serial number on that system. You must set the serial number on the SGM server and the SGM client.
| Tip: Verify that you correctly entered the serial number before you click on the Commit button. You cannot change the serial number once it has been submitted. |
Figure 4-5. Linux System SN Window (SGM Server that has Multiple Clients without Serial Numbers Entered)
 |
The global configuration parameters define global ESP behaviors and are divided into the following categories:
Global event handling parameters, which determine if ESP should register events, throttle events, and perform any actions
Global availability parameter, which determines if a reason must be supplied when the system is shutdown
Global registration parameters, which determine if event information is returned to SGI, the format of the message that contains the event information, and any additional recipients of the message
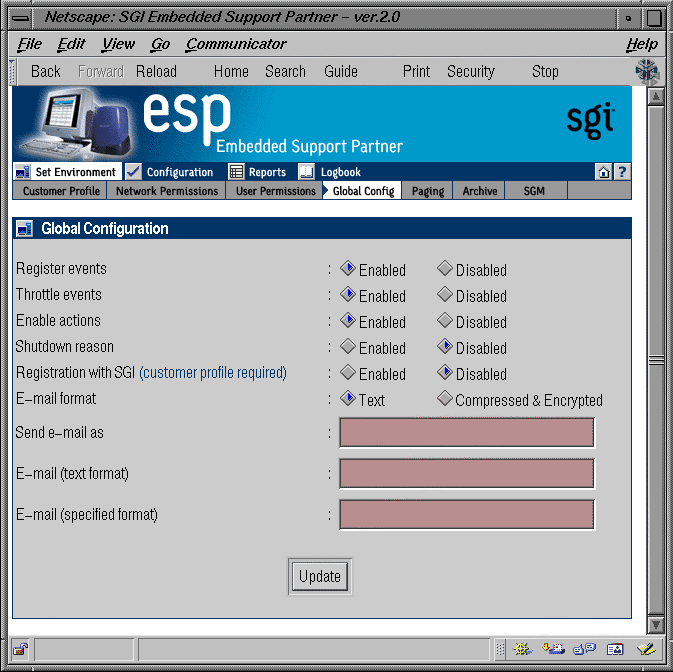
Perform the following procedure to use the Web-based interface to set up the global configuration parameters:
Click on the Set Environment button.
Click on the Global Config button.

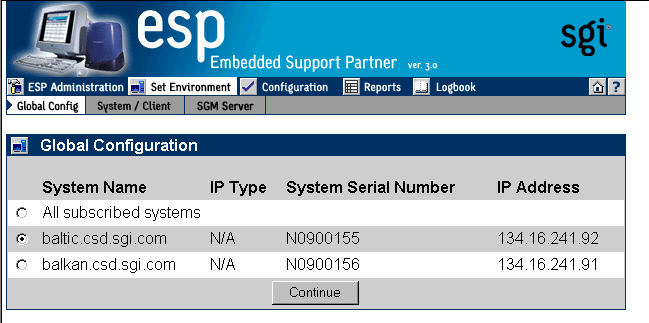
Note: If the system is an SGM server, choose the system for which you want to update the global configuration parameters, and click on the Continue button. (Refer to Figure 4-6.) The interface displays the Global Configuration window. (Refer to Figure 4-7.)
Set the parameters. (Table 4-1 describes the global configuration parameters.)
Table 4-1. Global Configuration Parameters
Parameter
Description
Register events
Specifies whether or not ESP should register events in the ESP database
Set this parameter to Enabled if you want to register event information in the ESP database on your system
Set this parameter to Disabled if you do not want to register event information in the ESP database on your system (if you set this parameter to Disabled, it overrides the individual event settings)
Recommendation: Always set this parameter to Enabled to capture all event information in the ESP database on your system
Throttle events
Specifies whether or not ESP should throttle events
Set this parameter to Enabled to require that a specific number of events must occur before the event is registered in the ESP database on your system
Set this parameter to Disabled to register every event in the ESP database
Recommendation: Set this parameter to Enabled and configure the individual throttle values for each event
Enable actions
Specifies whether or not ESP should perform actions
Set this parameter to Enabled to specify that ESP should perform any assigned actions in response to all events that occur
Set this parameter to Disabled to specify that ESP should not perform actions for any events (if you set this parameter to Disabled, it overrides any action settings for individual events)
Recommendation: Set this parameter to Enabled and assign the desired actions for each event
Shutdown reason
Specifies whether or not users will be prompted to enter a reason when they shut down the system
Set this parameter to Enabled to prompt users for a reason whenever they shut down the system
Set this parameter to Disabled to allow users to shut down the system without providing a reason
Recommendation: Always set this parameter to Enabled to ensure that ESP generates accurate availability metrics
Registration with SGI
Specifies whether or not ESP should send data (system hardware and software information, event information, crash analysis reports, and system availability reports) to SGI at esp@sgi.com (under specific service contracts, SGI uses this data to open trouble tickets and respond to problems on your system before the problems affect system availability)
Set this parameter to Enabled to have ESP send e-mail messages to SGI
Set this parameter to Disabled to prevent ESP from sending e-mail messages to SGI
Recommendation: Always set this parameter to Enabled so SGI can provide proactive support for your system (providing this information helps the call center provide quick and accurate responses to problems on your system)
E-mail format[a]
Specifies the format for e-mail that ESP sends. ESP can send e-mail in plain text format or compressed and encrypted (uuencoded) format.
If e-mail is sent in compressed and encrypted format, recipients should use the amreceiver program to decode the e-mail; refer to the amreceiver man page for more information.
Recommendation: Set this parameter to Compressed & Encrypted.
Send e-mail as a
Specifies the name that appears in the "From" portion of the e-mail header. This option affects e-mail messages sent by espnotify, availmon, and espcall (when registration with SGI is enabled).
E-mail (text format) a
E-mail (specified format) aSpecify e-mail addresses that should receive e-mail from ESP. ESP sends these addresses the same messages that it sends to esp@sgi.com. If the Registration with SGI parameter is disabled, ESP sends e-mail to these addresses only; it does not send e-mail to esp@sgi.com.
The E-mail (text format) parameter specifies e-mail addresses that should receive the e-mail in plain text format.
The E-mail (specified format) parameter specifies e-mail addresses that should receive e-mail in the format specified by the E-mail format parameter.
Each field can hold up to 255 characters; you should separate multiple e-mail addresses with spaces or commas.
Recommendation: Enter e-mail addresses of local personnel that are interested in this information (for example, system administrators)
[a] Any changes that you make to these parameters from an SGM server affect all SGM clients that are currently subscribed to that server.
Click on the Update button. The interface displays a confirmation window.
Click on the Commit button.
You can use the espconfig command to update the global configuration parameters:
Use the following command syntax to view the current setting of the event registration parameter:
/usr/sbin/espconfig -show event_registration
                   [-sgmclient <client alias>|-sysid <system id>]
Use the following command syntax to enable event registration by ESP:
/usr/sbin/espconfig -enable event_registration
                   [-sgmclient <client alias>|-sysid <system id>]
Use the following command syntax to disable event registration by ESP:
/usr/sbin/espconfig -disable event_registration
                   [-sgmclient <client alias>|-sysid <system id>]
Use the following command syntax to view the current setting of the event throttling parameter:
/usr/sbin/espconfig -show event_throttling
                   [-sgmclient <client alias>|-sysid <system id>]
Use the following command syntax to enable event throttling:
/usr/sbin/espconfig -enable event_throttling
                   [-sgmclient <client alias>|-sysid <system id>]
Use the following command syntax to disable event throttling:
/usr/sbin/espconfig -disable event_throttling
                   [-sgmclient <client alias>|-sysid <system id>]
Use the following command syntax to view the current setting of the actions parameter:
/usr/sbin/espconfig -show event_actions
                   [-sgmclient <client alias>|-sysid <system id>]
Use the following command syntax to enable actions:
/usr/sbin/espconfig -enable event_actions
                   [-sgmclient <client alias>|-sysid <system id>]
Use the following command syntax to disable actions:
/usr/sbin/espconfig -disable event_actions
                   [-sgmclient <client alias>|-sysid <system id>]
Use the following command syntax to view the current setting of the shutdown description parameter:
/usr/sbin/espconfig -show shutdown_reason
                   [-sgmclient <client alias>|-sysid <system id>]
Use the following command syntax to prompt users for a description when they shut down the system:
/usr/sbin/espconfig -enable shutdown_reason
                   [-sgmclient <client alias>|-sysid <system id>]
Use the following command syntax to allow users to shut down the system without providing a reason:
/usr/sbin/espconfig -disable shutdown_reason
                   [-sgmclient <client alias>|-sysid <system id>]
Use the following command syntax to view the current setting of the call logging parameter:
/usr/sbin/espconfig -show call_logging
                   [-sgmclient <client alias>|-sysid <system id>]
Use the following command syntax to enable call logging (which sends event information to SGI to provide proactive support):
/usr/sbin/espconfig -enable call_logging  [-text|-comp_encoded]
                   [-sgmclient <client alias>|-sysid <system id>]
Note: You must set up a customer profile for call logging to work. The -text option specifies that ESP should send the e-mail message in plain text format; the -comp_encoded option specifies that ESP should send the message in uuencoded format. The e-mail address lists can contain up to 255 characters of comma separated e-mail addresses.
Use the following command syntax to disable call logging:
/usr/sbin/espconfig -disable call_logging
                   [-sgmclient <client alias>|-sysid <system id>]
Use the following command syntax to view the current setting of the e-mail parameter:
/usr/sbin/espconfig -show mail
Use the following command syntax to enable ESP to send e-mail messages and specify the e-mail account that sends the messages:
/usr/sbin/espconfig -enable mail -from <email address>
                   [-email1 <email address>]
                   [-email2 <email address>]
Use the following command syntax to disable ESP from sending e-mail messages:
/usr/sbin/espconfig -disable mail
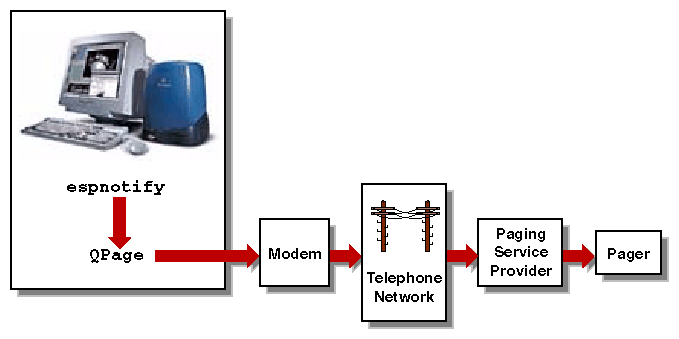
QuickPage (QPage) is a third-party client/server application that ESP uses to send messages to an alphanumeric pager. QPage uses a modem to send an IXO/TAP-protocol message to a telephone number that is connected to a paging service. QPage is integrated in the ESP software suite, and its services are accessed through the /usr/bin/espnotify application. (Refer to Figure 4-8.)
QPage is installed on your system by default and is chkconfig'ed off. Perform the following procedure to set it up and enable it:
Enter the following command to turn QPage on:
chkconfig quickpage on
Enter the following command to start the QPage server:
/etc/init.d/qpageserver start
Note: The QPage server automatically restarts whenever you reboot the system. Set up the following paging parameters:
Modem parameters that specify the modem that QPage should use to connect to the paging service provider.
Paging service provider parameters that provide information about the paging service provider and how to contact it.
Pager parameters that provide information about the pager to use.
The following sections describe how to set up these parameters.
| Note: The paging parameters are not included in the ESP 3.0 Web-based interface for the Linux OS. ESP 3.0 for the Linux OS does not include paging by default because SGI does not distribute the QPage application for the Linux OS. Paging capabilities are disabled when ESP 3.0 runs under the Linux OS. The ESP 3.0 graphical user interface for the Linux OS does not include the Paging menu. If you obtain the QPage application for the Linux OS from another source, you should manually install and configure it and then create an ESP action that calls the QPage application. |
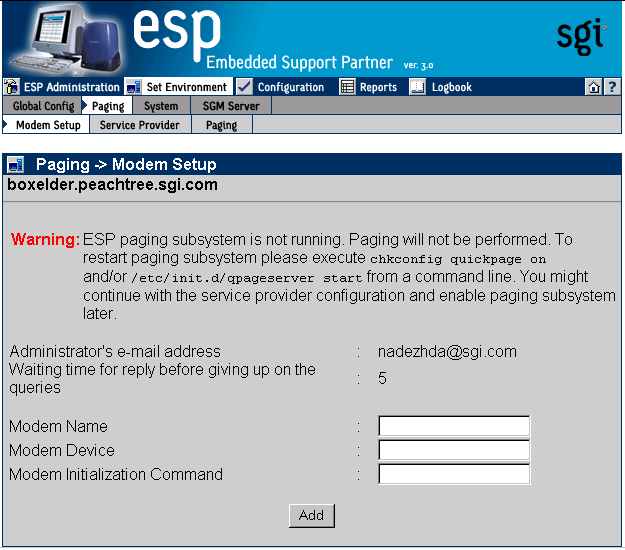
A modem must be connected to the system that is running ESP so that the software can send pages when events occur. You must specify the device to which the modem is connected and specify the modem initialization command. (ESP has been tested with the U. S. Robotics Sportster fax modem with X2.)
Perform the following procedure to use the Web-based interface to set up the modem parameters:
Click on the Set Environment button.
Click on the Paging button.
By default, the interface displays the Paging -> Modem Setup window. (Refer to Figure 4-9.)
Enter a modem name in the Modem Name field (do not include blank spaces).
Enter the device name to which the modem is connected in the Modem Device field. (Example: /dev/ttyd)
Enter the modem initialization command in the Modem Initialization Command field. (Example: ATZ)
Be aware of the following information when you configure the initialization command:
The initialization command is specific to the modem that you are using. Refer to your modem user manual for specific details about the initialization command.
The initialization command can vary, based on requirements from your paging service provider. For example, many paging services require you to turn off error correction on your modem. (This can be done on the U. S. Robotics Sportster fax modem with X2 with the &A0&K0&M0 initialization command.) Contact your paging service provider to determine any special requirements.
Click on the Add button.
The interface displays a confirmation window.
Click on the Commit button
Once you have a modem configured, you have the following options to modify the modem parameters when you click on the Modem Setup button:
To add a new modem, click on the Add button.
To update a modem, click on the check box next to the modem and then click on the Update button.
To delete a modem, click on the check box next to the modem and then click on the Delete button. (Deleting a modem deletes all paging service providers and pagers that are assigned to it.)
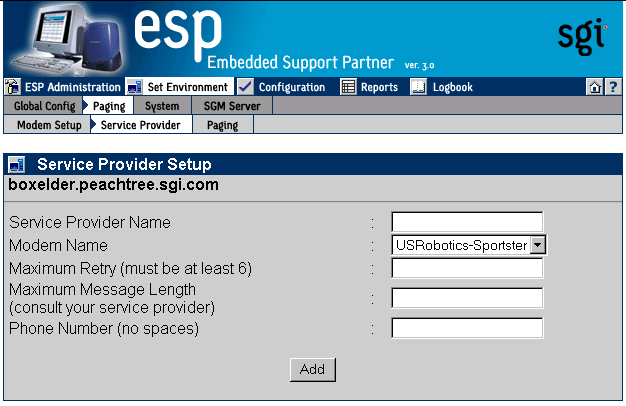
You need to provide ESP with information about the paging service that you use so it can properly contact your pager.
Click on the Set Environment button.
Click on the Paging button.
Click on the Service Provider button.
The interface displays the Service Provider Setup window. (Refer to Figure 4-10.)
Update the parameters. (Table 4-2 describes the parameters.)
Table 4-2. Paging Service Provider Parameters
Parameter
Description
Service Provider Name
Specifies the name of the paging service
The interface displays this name on other pages to identify the paging service (Do not include blank spaces)
Modem Name
Specifies the modem to use
Select the modem from the menu
If the modem that you want to use is not in the menu, click on the Modem Setup button to add it
Maximum Retry (must be at least 6)
Specifies the number of times that ESP should attempt to contact this paging service
Maximum Message Length (consult your service provider)
Specifies the maximum number of characters that this service will accept
Contact your paging service provider for this information
Phone number (no spaces)
Specifies the phone number that ESP should dial to contact the paging service (Enter only numbers in this field; for example 17151234567)
Click on the Add button.
The interface displays a confirmation window.
Click on the Commit button
Once you have a paging service provider configured, you have the following options to modify the parameters when you click on the Service Provider button:
To add a new paging service provider, click on the Add button.
To update the paging service provider parameters, click on the check box next to the service provider name and then click on the Update button.
To delete the paging service provider, click on the check box next to the service provider name and then click on the Delete button. (Deleting a paging service provider deletes all pagers assigned to it.)
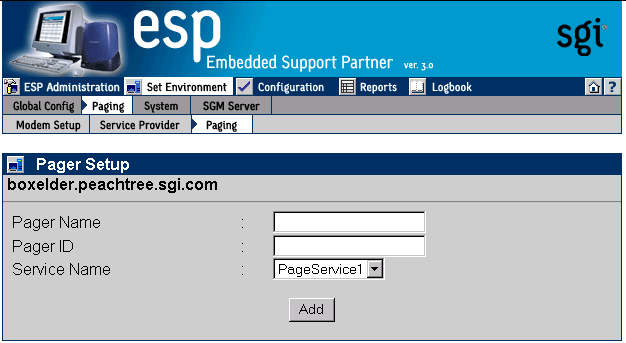
You also need to provide information about the pager that you want to use so ESP can properly contact it.
Click on the Set Environment button.
Click on the Paging button.
Click on the Paging button.
The interface displays the Pager Setup window. (Refer to Figure 4-11.)
Enter a unique name for the pager in the Pager Name field. (Do not include blank spaces.) ESP uses this name on other interface pages to identify the pager.
Enter the pager identification number in the Pager ID field.
Your paging service provider assigns a unique pager identification number to each individual pager. This number could differ from the telephone number that you dial to access the pager. Contact your paging service provider to determine the pager identification number of your pager.
Choose the paging service provider that you want to use from the list of available paging service providers. (If you do not see the provider that you want to use, click on the Service Provider button to add it.)
Click on the Add button.
The interface displays a confirmation window.
Click on the Commit button
Once you have a pager configured, you have the following options to modify the parameters when you click on the Service Provider button:
To add a new pager, click on the Add button.
To update the pager parameters, click on the check box next to the pager name and then click on the Update button.
To delete the pager, click on the check box next to the pager name and then click on the Delete button.
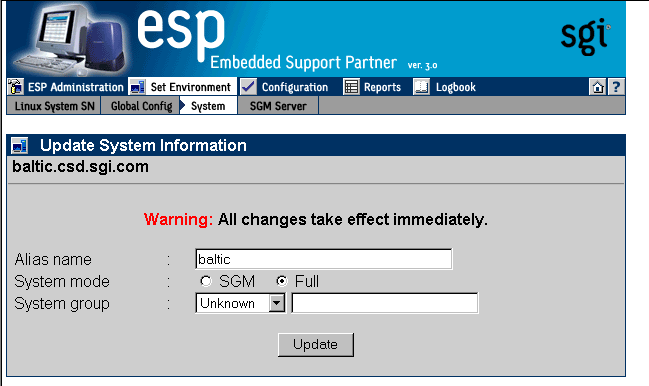
The system parameters enable you to set up an alias name, select the system mode (full or SGM), and add the system to a group.
Perform the following procedure to update the system parameters in single system manager mode:
Click on the Set Environment button.
Click on the System button.
The interface displays the Update System Information window. (Refer to Figure 4-12.)
Set the parameters. (Table 4-3 describes the parameters that are available.)
Click the Update button.
Table 4-3. Update System Information Window Parameters (Single System Manager Mode)
Parameter
Description
Alias
Specifies an alias that ESP uses to identify the SGM server.
This parameter is optional. If you do not set this parameter, ESP uses the hostname of the client (without the domain name).
This parameter can contain any non-blank-space character, except for single or double quotes.
System mode
Specifies how the system is configured.
There are two choices: SGM and Full node (default)
The SGM option configures the system to be a system group manager system.
The Full node option configures the system as a single system manager. The system does not have any clients.
System group
Specifies the group to which the system belongs. You can use groups to quickly access information about all systems in a group by generating a site report. Example group names include Server, Desktop, Web Server, and File Server.
To create a new group, enter the name in the System group field. Once you create one or more group names, ESP displays a menu of the existing groups; to select an existing group, choose it from the menu.
Note: When you enter group names, the entry in the field takes precedence over the selection in the menu. The proper way to create a new group is to set the menu to New Group and enter the group name in the System Group field.
The following three rules apply for creating group names:
1) The case of characters does not matter. (ESP puts systems hat you enter in the groups named “Web server” and “Web Server” in the same group.)
2) Spacing between characters does matter. (ESP puts systems that you enter in the groups named “Web server” and “Web server” in different groups.)
3) Single and double quotes are not allowed.
This parameter is optional.
The system/client parameters enable you to add a new SGM client to an SGM server, update system parameters for an SGM server or one of its SGM clients, and unsubscribe an SGM client from an SGM server.
Click on the Set Environment button.
Click on the System button.
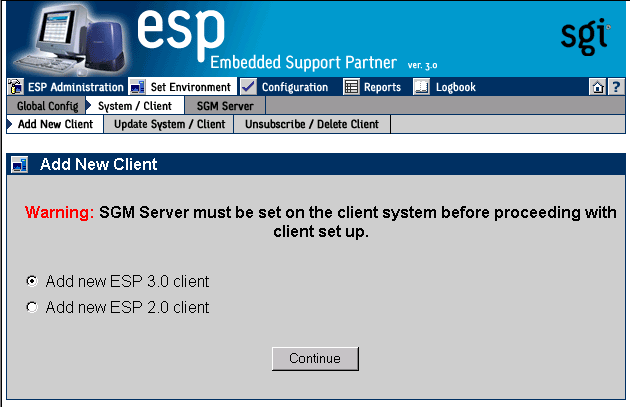
Click on the Add New Client button.
The interface displays the Add New Client window. (Refer to Figure 4-13.)
Select the type of client to add (ESP 3.0 or ESP 2.0 client).
Click on the Continue button.
Figure 4-14 shows the Add New Client window for an ESP 3.0 client.
Figure 4-15 shows the Add New Client window for an ESP 2.0 client.
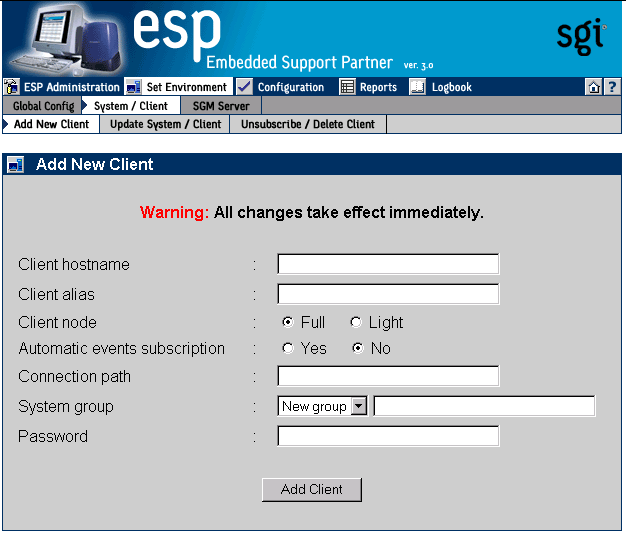
Set the parameters for the client. (Table 4-4 describes the parameters that are available.)
Click on the Add Client button.
Click on the Continue button.
For ESP 3.0 clients, ESP immediately subscribes the system without waiting for additional verification. If ESP cannot establish a connection between systems, ESP displays a message that indicates this. For ESP 2.0 clients, you must also configure SGM clients from the client side.
Table 4-4. Add New Client Window Parameters
Parameter
Description
Client hostname
Specifies the fully qualified hostname of a client system.
Client alias
Specifies an alias that ESP uses to identify the client.
This parameter is optional. If you do not set this parameter, ESP uses the hostname of the client (without the domain name).
This parameter can contain any non-blank-space character, except for single or double quotes.
Client node [a]
Specifies how the client is configured.
There are two choices: Full and Light (default).
A full node is an SGM client that sends data to an SGM server and also keeps a copy of all data in its own database. Full nodes require more local disk space than light nodes.
A light node is an SGM client that sends data to an SGM server but does not keep any data in its own database.
You can convert a light node to a full node at any time; however, only data that is generated after the conversion completes is stored in the local database. (Data generated before the conversion completes is stored only in the database on the SGM server.)
Automatic events subscription a
Specifies whether or not ESP should automatically subscribe events with the Event Manager. If you set this parameter to Yes, you do not need to manually subscribe the event (with the Subscription button).
Connection path a
Specifies the connection path between the SGM server and this client.
This parameter applies only to ESP 3.0 clients. ESP 2.0 clients ignore this parameter.
ESP 3.0 does not require an SGM to know the hostname and IP address information for its clients. ESP 3.0 allows an intermediate system to know this information about the SGM and client systems. This enables ESP to work through a firewall.
For example, system A is an SGM server and system D is a client, but system A does not know the hostname or IP address of system D. However, system B knows about systems A and C, and system C knows about systems B and D. ESP 3.0 allows you to add system D as a client to system A by specifying the connection path as follows:
B>C
This means that events are forwarded from system D to system A, following the connection path through system C and system B.
If only one system is intermediate, enter a fully qualified hostname of that system. If a direct connection can be established between SGM server and client systems, leave this field blank.
Note: A connection path must be specified in the direction from the SGM server towards a client. The SGM server and client hostnames should be omitted. All systems name must be fully qualified hostnames.
System group
Specifies the group to which the client belongs. You can use groups to quickly access information about all systems in a group by generating a site report. Example group names include Server, Desktop, Web Server, and File Server.
To create a new group, enter the name in the System group field. Once you create one or more group names, ESP displays a menu of the existing groups; to select an existing group, choose it from the menu.
Note: When you enter group names, the entry in the field takes precedence over the selection in the menu. The proper way to create a new group is to set the menu to New Group and enter the group name in the System Group field.
The following three rules apply for creating group names:
1) The case of characters does not matter. (ESP puts systems hat you enter in the groups named “Web server” and “Web Server” in the same group.)
2) Spacing between characters does matter. (ESP puts systems that you enter in the groups named “Web server” and “Web server” in different groups.)
3) Single and double quotes are not allowed.
This parameter is optional.
Password
Specifies a password that the server and client must exchange before transmitting data (to provide stronger security via authentication)
This parameter is optional for ESP 3.0 clients. This parameter is required for ESP 2.0 clients. If you require a password, you must configure it on the client side first.
[a] This parameter appears only for ESP 3.0 clients.
Perform the following procedure to update the SGM server (system) or an SGM client in system group manager mode:
Click on the Set Environment button.
Click on the System/Client button.
Click on the Update System/Client button.
The interface displays the Update System/Client window. (Refer to Figure 4-16.)
Select the system to update.
Click on the Continue button.
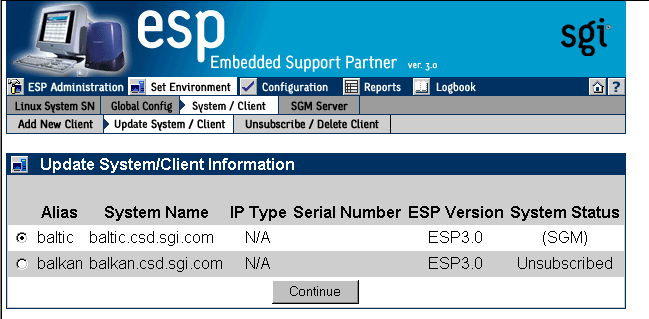
If you select the local system (the SGM server), ESP displays the Update System Information window. (Refer to Figure 4-17.)
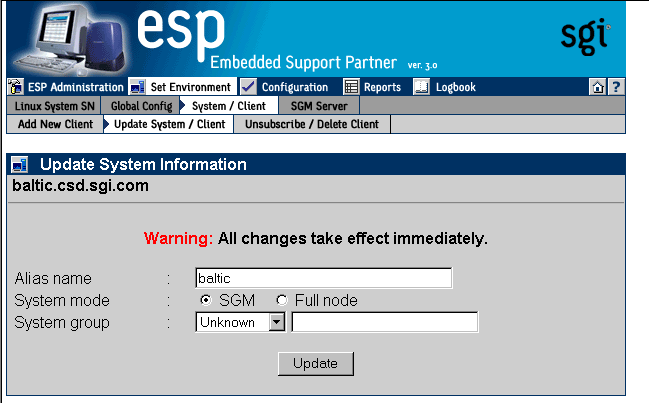
Set the parameters. (Table 4-5 describes the parameters that are available.)
Click the Update button.
Table 4-5. Update System Information Window Parameters (SGM Server)
Parameter
Description
Alias
Specifies an alias that ESP uses to identify the SGM server.
This parameter is optional. If you do not set this parameter, ESP uses the hostname of the client (without the domain name).
This parameter can contain any non-blank-space character, except for single or double quotes.
System mode
Specifies how the system is configured.
There are two choices: SGM (default) and Full nodeThe SGM option configures the system to be a system group manager system.
The Full node option configures the system as a single system manager. The system does not have any clients.
System group
Specifies the group to which the system belongs. You can use groups to quickly access information about all systems in a group by generating a site report. Example group names include Server, Desktop, Web Server, and File Server.
To create a new group, enter the name in the System group field. Once you create one or more group names, ESP displays a menu of the existing groups; to select an existing group, choose it from the menu.
Note: When you enter group names, the entry in the field takes precedence over the selection in the menu. The proper way to create a new group is to set the menu to New Group and enter the group name in the System Group field.
The following three rules apply for creating group names:
1) The case of characters does not matter. (ESP puts systems hat you enter in the groups named “Web server” and “Web Server” in the same group.)
2) Spacing between characters does matter. (ESP puts systems that you enter in the groups named “Web server” and “Web server” in different groups.)
3) Single and double quotes are not allowed.
This parameter is optional.
If you select an ESP 3.0 SGM client, ESP displays the Update Client Information window shown in Figure 4-18.
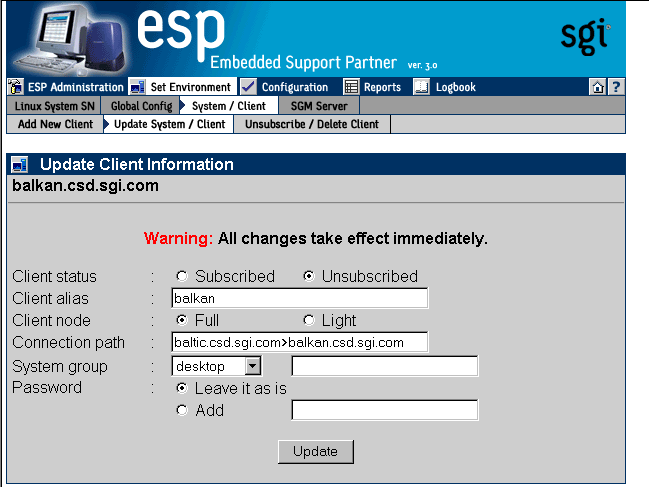
Set the parameters. (Table 4-6 describes the parameters that are available.)
Click the Update button.
Table 4-6. Update Client Information Window Parameters (ESP 3.0 SGM Client)
Parameter
Description
Client alias
Specifies an alias that ESP uses to identify the client.
This parameter is optional. If you do not set this parameter, ESP uses the hostname of the client (without the domain name).
This parameter can contain any non-blank-space character, except for single or double quotes.
Client node
Specifies how the client is configured:
Full and LightA full node is an SGM client that sends data to an SGM server and also keeps a copy of all data in its own database. Full nodes require more local disk space than light nodes.
A light node is an SGM client that sends data to an SGM server but does not keep any data in its own database.
You can convert a light node to a full node at any time; however, only data that is generated after the conversion completes is stored in the local database. (Data generated before the conversion completes is stored only in the database on the SGM server.)
This parameter applies only to ESP 3.0 clients.
Connection path
Specifies the connection path between the SGM server and this client.
This parameter applies only to ESP 3.0 clients. ESP 2.0 clients ignore this parameter.
ESP 3.0 does not require an SGM to know the hostname and IP address information for its clients. ESP 3.0 allows an intermediate system to know this information about the SGM and client systems. This enables ESP to work through a firewall.
For example, system A is an SGM server and system D is a client, but system A does not know the hostname or IP address of system D. However, system B knows about systems A and C, and system C knows about systems B and D. ESP 3.0 allows you to add system D as a client to system A by specifying the connection path as follows:
B>C
This means that events are forwarded from system D to system A, following the connection path through system C and system B.
If only one system is intermediate, enter a fully qualified hostname of that system. If a direct connection can be established between SGM server and client systems, leave this field blank.
Note: A connection path must be specified in the direction from the SGM server towards a client. The SGM server and client hostnames should be omitted. All systems name must be fully qualified hostnames.
System group
Specifies the group to which the client belongs. You can use groups to quickly access information about all systems in a group by generating a site report. Example group names include Server, Desktop, Web Server, and File Server.
To create a new group, enter the name in the System group field. Once you create one or more group names, ESP displays a menu of the existing groups; to select an existing group, choose it from the menu.
Note: When you enter group names, the entry in the field takes precedence over the selection in the menu. The proper way to create a new group is to set the menu to New Group and enter the group name in the System Group field.
The following three rules apply for creating group names:
1) The case of characters does not matter. (ESP puts systems hat you enter in the groups named “Web server” and “Web Server” in the same group.)
2) Spacing between characters does matter. (ESP puts systems that you enter in the groups named “Web server” and “Web server” in different groups.)
3) Single and double quotes are not allowed.
This parameter is optional.
Password
Specifies a password that the server and client must exchange before transmitting data (to provide stronger security via authentication)
This parameter is optional. If you require a password, you must configure it on the client side first. Use the Leave it as is option to retain an existing password. Use the Add option to add a new password.
If you select an ESP 2.0 SGM client, ESP displays the Update Client Information window shown in Figure 4-19.
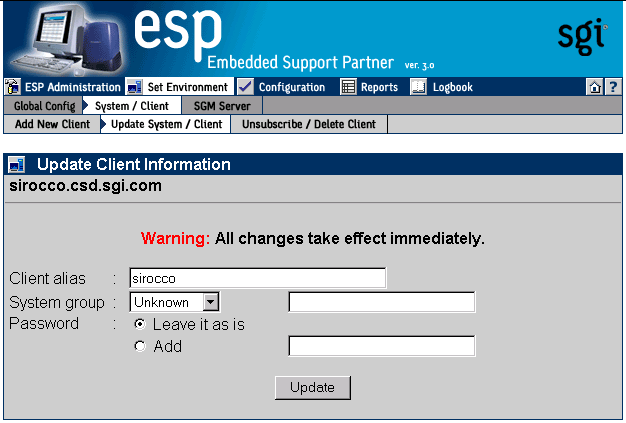
Set the parameters. (Table 4-7 describes the parameters that are available.)
Click the Update button.
Table 4-7. Update Client Information Window Parameters (ESP 2.0 SGM Client)
Parameter
Description
Client alias
Specifies an alias that ESP uses to identify the client.
This parameter is optional. If you do not set this parameter, ESP uses the hostname of the client (without the domain name).
This parameter can contain any non-blank-space character, except for single or double quotes.
System group
Specifies the group to which the client belongs. You can use groups to quickly access information about all systems in a group by generating a site report. Example group names include Server, Desktop, Web Server, and File Server.
To create a new group, enter the name in the System group field. Once you create one or more group names, ESP displays a menu of the existing groups; to select an existing group, choose it from the menu.
Note: When you enter group names, the entry in the field takes precedence over the selection in the menu. The proper way to create a new group is to set the menu to New Group and enter the group name in the System Group field.
The following three rules apply for creating group names:
1) The case of characters does not matter. (ESP puts systems hat you enter in the groups named “Web server” and “Web Server” in the same group.)
2) Spacing between characters does matter. (ESP puts systems that you enter in the groups named “Web server” and “Web server” in different groups.)
3) Single and double quotes are not allowed.
This parameter is optional.
Password
Specifies a password that the server and client must exchange before transmitting data (to provide stronger security via authentication)
This parameter is required. You must configure the password on the client side first. Use the Leave it as is option to retain an existing password. Use the Add option to add a new password.
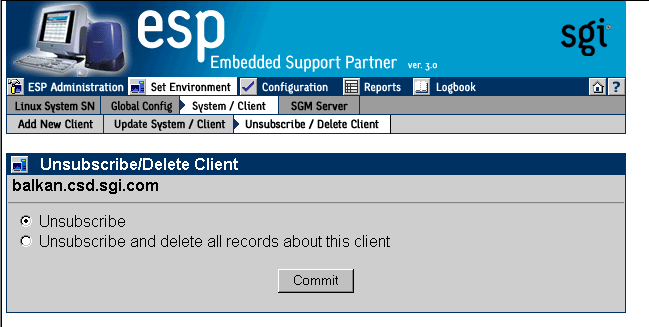
If a system is subscribed, you can either unsubscribe a client or unsubscribe and delete it:
When you unsubscribe a client, the client no longer sends events to the SGM server, and changes occur on the client system. If a client system is a light node and subscribed to only one SGM server, the client system resets to a full node once the unsubscription process completes. If a client system is a full node or is subscribed to two or more SGM servers, the mode for that node remains the same. All information about an unsubscribed client for the period of time that the system was subscribed to the SGM server remains available on the SGM system.
When unsubscribe a delete a system, the same actions occur, and all information for the system (including reports) is removed from the SGM server.
| Tip: If an ESP SGM license expires and you do not plan to renew it, enter the espconfig -unsubscribe sgmclient command to unsubscribe the clients. |
Perform the following procedure to unsubscribe a system:
Click on the Set Environment button.
Click on the System/Client button.
Click on the Unsubscribe/Delete Client button.
The interface displays the Unsubscribe/Delete Client window. (Refer to Figure 4-20.)
Note: If more than one client is subscribed to the SGM server, the interface displays a list of clients. Select the client that you want to unsubscribe and click on the Continue button.
Specify if you want to unsubscribe the client or unsubscribe and delete the client. (ESP 2.0 clients are unsubscribed immediately. For ESP 3.0 clients, you must commit the unsubscription on a verification screen before ESP will unsubscribe them.)
Note: When you unsubscribe an ESP 2.0 client on the server side, SGI recommends that you also unregister the server on the ESP 2.0 client side. Click on the Commit button.
You can use authentication between the SGM server and clients to provide stronger security. Authentication requires the SGM server to exchange and authenticate a password before any data transactions can occur. You must configure the password on the client side and then on the server side.
Perform the following procedure to set up a password on the client side in single system manager mode:
Click on the Set Environment button.
Click on the SGM Server button.
Click on the Add Password for a New Server button.
The interface displays the Add Password for a New Server window. (Refer to Figure 4-21.)
Enter the fully qualified hostname of the SGM server in the Server hostname field.
Enter the password in the Password field.
Click on the Add button.
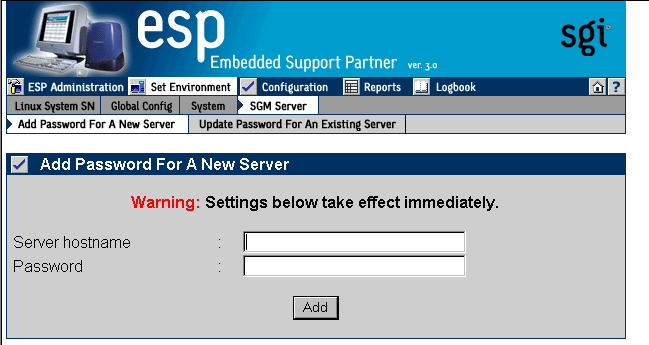
ESP immediately adds the password. Be sure to configure the same password on the SGM server when you add the client to the server. (Refer to “Adding a New SGM Client”.)
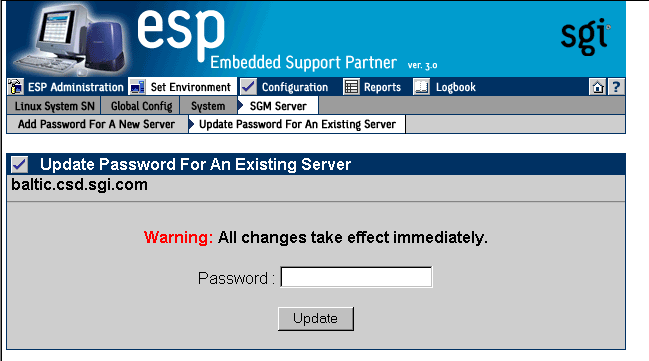
Perform the following procedure to update a password that you previously assigned to a server:
Click on the Set Environment button.
Click on the SGM Server button.
Click on the Update Password for an Existing Server button.
The interface displays the Update Password for an Existing Server window. (Refer to Figure 4-22.)
Note: If the client has more than one SGM server, select the server for which you want to update the password, and click on the Continue button.
Enter the new password in the Password field.
Tip: To remove a password, leave the Password field empty. Click on the Update button.
You can use the espconfig command to register an SGM server.
Use the following command syntax to register a server:
/usr/sbin/espconfig -add sgmserver -host <SGM host name>
The command prompts you for a communication password.
You can use the espconfig command to configure SGM clients.
Use the following command syntax to register a client:
/usr/sbin/espconfig -add sgmclient <client alias> <client hostname> <server alias>
The command prompts you for a communication password.
Use the following command syntax to add a client:
/usr/sbin/espconfig -add  sgmclient -alias <client alias>
             -host <client hostname>
             [-path <client reach path>]
             [-group <group descr.>|-gid <group id>]
             [-v2|-v3] [-p <password>]
Use the following command syntax to subscribe a client:
/usr/sbin/espconfig -subscribe  sgmclient
          -host <host name>|-alias <client alias>|-sysid <system id>
          [-loadprofiles] [-refreshprofiles] [-lightnode|-fullnode]           [-force]
Use the following command syntax to unsubscribe a client:
/usr/sbin/espconfig -unsubscribe  sgmclient
         -host <host name>|-alias <client alias>|-sysid <system id>
        [-force]
Use the following command syntax to update a client:
/usr/sbin/espconfig -update  sgmclient
          -host <host name>|-alias <client alias>|-sysid <system id>
          [-p <password>] [-path <new path>] [-lightnode|-fullnode]
Use the following command syntax to delete a client:
/usr/sbin/espconfig -delete  sgmclient
          -host <host name>|-alias <client alias>|-sysid <system id>
Use the following command syntax to ping a client:
/usr/sbin/espconfig ping
     -sgmclient <client alias>|-sysid <system id>|-path <reach path>
    [-espver]
You can use the espconfig to check and configure general SGM settings.
Use the following command syntax to show the systems that an SGM knows:
/usr/sbin/espconfig -show systems
Use the following command syntax to show an SGM's clients:
/usr/sbin/espconfig -show sgmclients
Use the following command syntax to show the SGM servers configured for a system:
/usr/sbin/espconfig -show sgmservers
Use the following command syntax to show information about a system:
/usr/sbin/espconfig -show system
    -host <host name>|-sgmclient <client alias>|-sysid <system id>
Use the following command syntax to set group management parameters for a system:
/usr/sbin/espconfig -set system -host <host name>|-sysid <system id>
             [-alias <new alias>]
             [-group <group name> | -gid <group id> ]
Use the following command syntax to configure a system (node) in SGM or full mode:
/usr/sbin/espconfig -setnode system -sgmnode|-fullnode
Use the following command syntax to get information about the SGM license or update it:
/usr/sbin/espconfig -check system -sgmlicense|-update
Use the following command syntax to update the SGM license key:
/usr/sbin/espconfig -update sgmkey -host <host name> -p <comm. password> [-pid <key ID>]
You can use the espconfig command to create and manage named groups.
Use the following command syntax to create a new group name:
espconfig -add group -name <new group name>
Use the following command syntax to delete a group name:
espconfig -delete group -name <group name>
Use the following command syntax to list the groups that are available:
espconfig -list group
Use the following command syntax to list the members of a group:
espconfig -listmembers group -name <group name>
You can use the espconfig command to import and export ESP environments between systems. The espconfig command transfers the following environmental information: global configuration parameters, user configuration parameters, and IP address “allow access” and “restrict access” lists. All changes are effective immediately.
Use the following command syntax to save an ESP environment:
/usr/sbin/espconfig -save espenv [global] [ipaddr] [user] [site|customer_profile] [all] [-to <filename> ]
Use the following command syntax to load an ESP environment:
/usr/sbin/espconfig -load espenv [-sysid <client system id>]
    [-chk <check definition filename>]
     -from <data definition filename>