This chapter describes the performance monitoring tools available in Performance Co-Pilot (PCP). This product provides a group of commands and tools for measuring system performance. Each tool is described completely by its own man page. The man pages are accessible through the man command. For example, the man page for the tool pmchart is viewed by entering the following command:
man pmchart |
The following major sections are covered in this chapter:
“The pmkstat Command”, discusses pmkstat, a utility that provides a periodic one-line summary of system performance.
“The pmval Command”, describes pmval, a utility that displays performance metrics in ASCII tables.
“The pmem Command”, discusses pmem, a utility that reports per-process memory usage statistics.
“The pminfo Command”, describes pminfo, a utility that displays information about performance metrics.
“The pmstore Command”, describes the use of the pmstore utility to arbitrarily set or reset selected performance metric values.
“The oview Origin Visualization Tool”, describes the oview, a utility that displays the topology of SGI 3000 series and SGI 2000 series of systems with dynamic updates for performance information about CPUs, nodes, and routers.
Further monitoring tools covering automated reasoning about performance are described in Chapter 5, “Performance Metrics Inference Engine”.
The following sections describe the various graphical and text-based PCP tools used to monitor local or remote system performance.
The pmkstat command provides a periodic, one-line summary of system performance. This command is intended to monitor system performance at the highest level, after which other tools may be used for examining subsystems to observe potential performance problems in greater detail. After entering the pmkstat command, you see output similar to the following, with successive lines appearing periodically:
pmkstat # hostname load avg: 0.26, interval: 5 sec, Thu Jan 19 12:30:13 1995 runq | memory | system | disks| cpu mem swp | free page | scall ctxsw intr| rd wr|usr sys idl wt 0 0 16268 0 64 19 2396 0 0 0 1 99 0 0 0 16264 0 142 45 2605 0 8 0 2 97 0 0 0 16268 0 308 62 2532 0 1 1 1 98 0 0 0 16268 0 423 88 2643 0 0 1 1 97 0 |
An additional line of output is added every five seconds. The update interval may be varied using the -t interval option.
The output from pmkstat is directed to standard output, and the columns in the report are interpreted as follows:
| runq | Average number of runnable processes in main memory (mem) and in swap memory (swp) during the interval. | |
| memory | The free column indicates average free memory during the interval, in kilobytes. The page column is the average number of page-out operations per second during the interval. I/O operations caused by these page-out operations are included in the disk write I/O rate. | |
| system | System call rate (scall), context switch rate (ctxsw), and interrupt rate (intr). Rates are expressed as average operations per second during the interval. | |
| disks | Aggregated physical read (rd) and write (wr) rates over all disks, expressed as physical I/O operations issued per second during the interval. These rates are independent of the I/O block size. | |
| cpu | Percentage of CPU time spent executing user code (usr), system and interrupt code (sys), idle loop (idl) and idle waiting for resources (wt), typically disk I/O. |
As with most PCP utilities, real-time metric, and archive logs are interchangeable.
For example, the following command uses the PCP archive log foo and the timezone of the host (tokyo) from which performance metrics in the archive were collected:
pmkstat -a foo -z Note: timezone set to local timezone of host "tokyo" # tokyo load avg: 1.06, interval: 5 sec, Thu Feb 2 08:42:55 1995 runq | memory | system | disks | cpu mem swp| free page| scall ctxsw intr| rd wr|usr sys idl wt 0 0 4316 0 195 64 2242 32 21 0 3 8 89 0 0 3976 0 279 86 2143 50 17 0 5 8 87 1 0 3448 0 186 63 2304 35 14 0 4 9 87 0 0 4364 0 254 81 2385 35 0 0 4 9 87 0 0 3696 0 266 92 2374 41 0 0 3 9 88 0 0 2668 42 237 81 2400 44 2 1 4 7 89 0 0 4644 100 206 68 2590 25 1 0 3 5 91 0 0 5384 0 174 63 2296 32 22 0 2 8 89 0 0 4736 0 189 65 2197 31 28 0 3 8 89 pmFetch: End of PCP archive log |
For complete information on pmkstat usage and command line options, see the pmkstat(1) man page.
The pmval command dumps the current values for the named performance metrics. For example, the following command reports the value of performance metric proc.nprocs once per second (by default), and produces output similar to this:
pmval proc.nprocs
metric:    proc.nprocs
host:      localhost
semantics: instantaneous value
units:     none
samples:   indefinite
interval:  1.00 sec
            73
            72
            70
            75
75 |
In this example, the number of running processes was reported once per second.
Where the semantics of the underlying performance metrics indicate that it would be sensible, pmval reports the rate of change or resource utilization.
For example, the following command reports idle processor utilization for each of four CPUs on the remote host moomba, each five seconds apart, producing output of this form:
pmval -h moomba -t 5sec -s 4 kernel.percpu.cpu.idle
metric:    kernel.percpu.cpu.idle
host:      moomba
semantics: cumulative counter (converting to rate)
units:     millisec (converting to time utilization)
samples:   4
interval:  5.00 sec
        cpu0        cpu1        cpu2        cpu3
        0.8193      0.7933      0.4587      0.8193
        0.7203      0.5822      0.8563      0.7303
        0.6100      0.6360      0.7820      0.7960
0.8276 0.7037 0.6357 0.6997 |
Similarly, the following command reports disk I/O read rate every minute for just the disk /dev/dsk/dks0d1, and produces output similar to the following:
pmval -t 1min -i dks0d1 disk.dev.read
metric:    disk.dev.read
host:      localhost
semantics: cumulative counter (converting to rate)
units:     count (converting to count / sec)
samples:   indefinite
interval:  60.00 sec
        dks0d1
         33.67
         48.71
         52.33
         11.33
2.333 |
The -r flag may be used to suppress the rate calculation (for metrics with counter semantics) and display the raw values of the metrics.
When used in conjunction with a PCP archive, the -g option may be used to associate a PCP time control dialog (see “Time Duration and Control” in Chapter 3) with the execution of pmval to support temporal navigation within the archive. In the example below, manipulation of the time within the archive is achieved by the exchange of time control messages between pmval and pmtime.
pmval -g -a /var/adm/pcplog/myserver/960801 |
The pmval command is documented by the pmval(1) man page, and annotated examples of the use of pmval are in the PCP Tutorial.
The pmem command reports per-process memory usage statistics within the PCP framework.
Both virtual size and prorated physical memory usage are reported. The virtual memory usage statistics represent the total virtual size of each process, irrespective of how many pages are valid (resident). Prorated physical memory statistics indicate real memory usage (only valid pages are counted) and are prorated on a per-page basis between all processes that reference each page. Thus the prorated physical memory counts reflect the real memory demands for individual processes in the context of the current process mix.
The output of pmem can be very large. Here is an abbreviated example of pmem output:
Host: gonzo Configured: 65536  Free:18380  Tue Jul 9 16:45:08 1996
     pid  ppid   user  vtxt  ptxt  vdat  pdat vshm pshm command
       1     0   root   232   144    84    76    0    0 /etc/init
     832   827   root  3204  1013  5796  3096    0    0 /usr/bin/X11/Xsg
     221     1   root  1424    54   156   84     0    0 /usr/lib/saf/sad
     838   827   root  2948    36   268    75    0    0 /usr/bin/X11/xdm
      86     1   root  1264    32   144    76    0    0 /usr/etc/syslogd
     182     1   root  1476   129   596   387    0    0 /usr/etc/rpcbind
     827     1   root  2948    13   252    22    0    0 /usr/bin/X11/xdm
     172     1   root  1276    52   148   100    0    0 /usr/etc/routed
Total     vtxt  ptxt   vdat  pdat  vshm  pshm  77 user processes
             121M        36256           0        =  157M virtual
13982 20194 0 = 34176 physical |
The columns report the following information:
| pid | Process ID number. |
| ppid | Parent process ID number. |
| user | Login name of the process owner. |
| vtxt | Total virtual memory used by text (executable code) regions mapped by the process. |
| ptxt | Prorated physical memory used by text regions. |
| vdat | Total virtual memory used by all non-executable regions, excluding shared memory regions. This includes initialized data, bss, and stack but not shared memory regions. |
| pdat | Prorated physical memory used by all data regions (data, bss, and stack but not shared memory regions). |
| vshm | Total virtual memory used by all shared memory regions. |
| pshm | Prorated physical memory used by shared memory regions. |
| command | The command and arguments. |
For complete information on pmem usage and command line options, see the pmem(1) man page.
The pminfo command displays various types of information about performance metrics available through the Performance Co-Pilot (PCP) facilities.
The -T option is extremely useful; it provides help text about performance metrics:
pminfo -T mem.util.fs_dirty mem.util.fs_dirty Help: The amount of memory in Kbytes that is holding file system data. |
The -t option displays the one-line help text associated with the selected metrics. The -T option prints more verbose help text.
Without any options, pminfo verifies that the specified metrics exist in the Name Space, and echoes those names. Metrics may be specified as arguments to pminfo using their full metric names. For example, this command returns the following response:
pminfo hinv.ncpu network.interface.total.bytes hinv.ncpu network.interface.total.bytes |
A group of related metrics in the Name Space may also be specified. For example, to list all of the hinv metrics you would use this command:
pminfo hinv hinv.ncpu hinv.cpuclock hinv.dcache hinv.icache hinv.secondarycache hinv.physmem hinv.pmeminterleave hinv.ndisk |
If no metrics are specified, pminfo displays the entire collection of metrics. This can be useful for searching for metrics, when only part of the full name is known. For example, this command returns the following response:
pminfo | grep nfs nfs.client.badcalls nfs.client.badcalls nfs.client.calls nfs.client.nclget nfs.client.nclsleep nfs.client.reqs nfs.server.badcalls nfs.server.calls nfs.server.reqs nfs.client.badcalls nfs.client.calls nfs.client.nclget nfs.client.nclsleep nfs.client.reqs nfs.server.badcalls nfs.server.calls nfs.server.reqs |
The -d option causes pminfo to display descriptive information about metrics (refer to the pmLookupDesc(3) man page for an explanation of this metadata information). The following command and response show use of the -d option:
pminfo -d proc.nprocs disk.dev.read filesys.free
    proc.nprocs
       Data Type: 32-bit int  InDom: PM_INDOM_NULL 0xffffffff
       Semantics: instant  Units: none
disk.dev.read
       Data Type: 32-bit unsigned int  InDom: 1.2 0x400002
       Semantics: counter  Units: count
filesys.free
       Data Type: 32-bit int  InDom: 1.7 0x400007
Semantics: instant Units: Kbyte |
The -f option to pminfo forces the current value of each named metric to be fetched and printed. In the example below, all metrics in the group hinv are selected:
pminfo -f hinv
hinv.ncpu
       value 1
hinv.cpuclock
       value 100
hinv.dcache
       value 8192
hinv.icache
       value 8192
hinv.secondarycache
       value 1048576
hinv.physmem
       value 64
hinv.pmeminterleave
       value 0
hinv.ndisk
value 1 |
The -h option directs pminfo to retrieve information from the specified host. If the metric has an instance domain, the value associated with each instance of the metric is printed:
pminfo -h babylon.engr.sgi.com -f filesys.mountdir
filesys.mountdir
       inst [1 or "/dev/root"] value "/"
       inst [2 or "/dev/dsk/dks1d3s7"] value "/usr2"
       inst [3 or "/dev/dsk/dks3d1s7"] value "/dbv"
       inst [4 or "/dev/dsk/dks3d4s7"] value "/dbv/d4"
       inst [5 or "/dev/dsk/dks3d2s7"] value "/dbv/d2"
       inst [6 or "/dev/dsk/dks3d3s7"] value "/dbv/d3"
       inst [7 or "/dev/dsk/dks2d4s7"] value "/vicepb"
       inst [8 or "/dev/dsk/xlv/build9"] value "/build9"
       inst [9 or "/dev/dsk/xlv/build8"] value "/build8"
       inst [10 or "/dev/dsk/xlv/lv9.xfs"] value "/lv9"
       inst [11 or "/dev/dsk/dks2d5s7"] value "/usenet"
       inst [12 or "/dev/dsk/xlv/work"] value "/usr/work"
       inst [13 or "/dev/dsk/xlv/build10"] value "/build10"
       inst [14 or "/dev/dsk/xlv/dist"] value "/usr/dist"
       inst [15 or "/dev/dsk/xlv/people"] value "/usr/people"
       inst [16 or "/dev/dsk/xlv/build12"] value "/build12"
inst [17 or "/dev/dsk/xlv/build11"] value "/build11" |
The -m option prints the Performance Metric Identifiers (PMIDs) of the selected metrics. This is useful for finding out which PMDA supplies the metric. For example, the output below identifies the PMDA supporting domain 4 (the leftmost part of the PMID) as the one supplying information for the metric environ.extrema.mintemp:
pminfo -m environ.extrema.mintemp environ.extrema.mintemp PMID: 4.0.3 |
The -v option verifies that metric definitions in the PMNS correspond with supported metrics, and checks that a value is available for the metric. Descriptions and values are fetched, but not printed. Only errors are reported.
Some instance domains are not enumerable. That is, it is not possible to ask for all of the instances at once. Only explicit instances may be fetched from such instance domains. This is because instances in such a domain may have a very short lifetime or the cost of obtaining all of the instances at once is very high. The proc metrics are an example of such an instance domain. The -f option is not able to fetch metrics with non-enumerable instance domains; however, the -F option tells pminfo to obtain a snapshot of all of the currently available instances in the instance domain and then to retrieve a value for each.
Complete information on the pminfo command is found in the pminfo(1) man page. There are examples of the use of pminfo in the PCP Tutorial.
From time to time you may wish to change the value of a particular metric. Some metrics are counters that may need to be reset, and some are simply control variables for agents that collect performance metrics. When you need to change the value of a metric for any reason, the command to use is pmstore.
| Note: For obvious reasons, the ability to arbitrarily change the value of a performance metric is not supported. Rather, the PMCS selectively allows some metrics to be modified in a very controlled fashion. |
The basic syntax of the command is as follows:
pmstore metricname value |
There are also command line flags to further specify the action. For example, the -i option restricts the change to one or more instances of the performance metric.
The value may be in one of several forms, according to the following rules:
If the metric has an integer type, then value should consist of an optional leading hyphen, followed either by decimal digits or “0x” and some hexadecimal digits; “0X” is also acceptable instead of “0x.”
If the metric has a floating point type, then value should be in the form of an integer (described above), a fixed point number, or a number in scientific notation.
If the metric has a string type, then value is interpreted as a literal string of ASCII characters.
If the metric has an aggregate type, then an attempt is made to interpret value as an integer, a floating point number, or a string. In the first two cases, the minimal word length encoding is used; for example, “123” would be interpreted as a four-byte aggregate, and “0x100000000” would be interpreted as an eight-byte aggregate.
The following example illustrates the use of pmstore to enable debugging of PMCD using the facilities of the pmcd PMDA. When the metric pmcd.control.debug has the value of 0, no debugging information is provided about PMCD. Storing values of 2048, 4096, or 8192 provides more debugging information which is written out to /var/adm/pcplog/pmcd.log as PMCD services responses from PMDAs configured and running on the system.
% pminfo -f pmcd.control.debug value 0 % pmstore pmcd.control.debug 2048 pmcd.control.debug old value=0 new value=2048 |
If you watch the file /var/adm/pcplog/pmcd.log using the command:
% tail -f /var/adm/pcplog/pmcd.log |
you will see PMCD sending debugging information about agent I/O connections to the log file. If no debugging output is evident (because PMCD is idle), you may need to use a client tool to request metrics from an agent in order to see PMCD in action:
% pminfo sample.seconds |
To stop this debugging output, use the following command:
% pmstore pmcd.control.debug 0 pmcd.control.debug old value=2048 new value=0 |
In this case, you will get debugging output relating to this operation as well.
For complete information on pmstore usage and syntax, see the pmstore(1) man page.
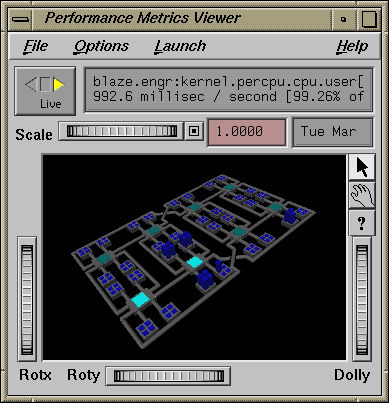
The oview tool displays the topology of SGI 3000 series and SGI 2000 series of systems with dynamic updates for performance information about CPUs, nodes, and routers. It behaves differently and produces different views for SGI 3000 series and SGI 2000 series of systems. See the oview(1) man page for details.
Figure 4-1 shows a view of an SGI 2000 series system as generated by the oview tool.
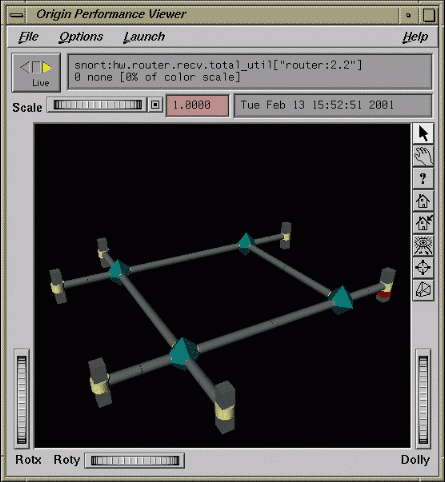
Figure 4-2 shows a view of an SGI 3000 series system. Systems with up-to 128 CPUs can be displayed.