The heap is a portion of memory used to support dynamic memory allocation/deallocation via the malloc and free function. This chapter describes heap corruption detection and covers the following topics:
Due to the dynamic nature of allocating and deallocating memory, the heap is vulnerable to the following typical corruption problems:
boundary overrun: a program writes beyond the malloc region.
boundary underrun: a program writes in front of the malloc region.
access to uninitialized memory: a program attempts to read memory that has not yet been initialized.
access to freed memory: a program attempts to read or write to memory that has been freed.
double frees: a program frees some structure that it had already freed. In such a case, a subsequent reference can pick up a meaningless pointer, causing a segmentation violation.
erroneous frees: a program calls free() on addresses that were not returned by malloc, such as static, global, or automatic variables, or other invalid expressions. See the malloc(3f) man page for more information.
To find heap corruption problems, you must relink your executable with the -lmalloc_ss library instead of the standard -lmalloc library. By default, the -lmalloc_ss library catches the following errors:
malloc call failing (returning NULL)
realloc call failing (returning NULL)
realloc call with an address outside the range of heap addresses returned by malloc or memalign
memalign call with an improper alignment
free call with an address that is improperly aligned
free call with an address outside the range of heap addresses returned by malloc or memalign
If you also set the MALLOC_FASTCHK environment variable, you can catch these errors:
free or realloc calls where the words prior to the user block have been corrupted
free or realloc calls where the words following the user block have been corrupted
free or realloc calls where the address is that of a block that has already been freed. This error may not always be detected if the area around the block is reallocated after it was first freed.
You can compile your executable from scratch as follows:
% cc -g -o targetprogram targetprogram.c -lmalloc_ss |
You can also relink it by using:
% ld -o targetprogram targetprogram.o -lmalloc_ss ... |
An alternative to rebuilding your executable is to use the _RLD_LIST environment variable to link the -lmalloc_ss library. See the rld(1) man page.
After compiling, invoke the Debugger with your executable as the target. In Execution View, you can set environment variables to enable different levels of heap corruption detection from within the malloc library, as follows:
For further information, see the malloc_ss(3) man page.
If you are using the -lmalloc_ss library, you can use the Trap Manager to set a stop trap at the exit from the function ssmalloc_error that is called when an error is detected. Errors are detected only during calls to heap management routines, such as malloc() and free(). Some kinds of errors, such as overruns, are not detected until the block is freed or realloced.
When you run the program, the program halts at the stop trap if a heap corruption error is detected. The error and the address are displayed in Execution View. You can also examine the Call Stack at this point to get stack information. To find the next error, click the Continue button.
If you need more information to isolate the error, set a watchpoint trap to detect a write at the displayed address. Then rerun your program. Use MALLOC_CLEAR_FREE and MALLOC_CLEAR_MALLOC to catch problems from attempts to access uninitialized or freed memory.
| Note: You can run programs linked with the -lmalloc_ss library outside of the Debugger. The trade-off is that you have to browse through the stderr messages and catch any errors through visual inspection. |
This tutorial demonstrates how to detect corruption errors by using the corrupt program. The corrupt program has already been linked with the SpeedShop malloc library (libmalloc_ss). The corrupt program listing is as follows:
#include <string.h>
void main (int argc, char **argv)
{
  char *str;
  int **array, *bogus, value;

  /* Let us malloc 3 bytes */
  str = (char *) malloc(strlen(“bad”));

  /* The following statement writes 0 to the 4th byte */
  strcpy(str, “bad”);

  free (str);

  /* Let us malloc 100 bytes */
  str = (char *) malloc(100);
  array = (int **) str;

  /* Get an uninitialized value */
  bogus = array[0];

  free (str);
  /* The following is a double free */
  free (str);
/* The following statement uses the uninitialized value as a pointer */
   value = *bogus;
} |
To start the tutorial:
Enter the following:
% mkdir demos
% mkdir demos/mallocbug
% cd demos/mallocbug
% cp /usr/demos/WorkShop/mallocbug/* .
Invoke the Debugger by typing:
% cvd corrupt &
The Main View window displays with corrupt as the target executable.
Open the Execution View window (if it is minimized) and set the _SSMALLOC_FASTCHK and _SSMALLOC_CLEAR_MALLOC environment variables.
If you are using the C shell, type:
% setenv _SSMALLOC_FASTCHK
% setenv _SSMALLOC_CLEAR_MALLOC
If you are using the Korn or Bourne shell, type:
$ _SSMALLOC_FASTCHK=
$ _SSMALLOC_CLEAR_MALLOC=
$ export _SSMALLOC_FASTCHK _SSMALLOC_CLEAR_MALLOC
To trap any malloc corruption problems, you must enter the following at the cvd command line:
cvd> set $pendingtraps=true
cvd> stop exit ssmalloc_error
A stop trap is set at the exit from the malloc library ssmalloc_error.
Enter the following at the cvd command line:
cvd> run
The program executes. Observe Execution View as the program executes.
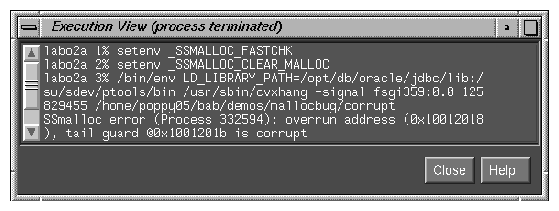
A heap corruption is detected and the process stops at one of the traps. The type of error and its address display in Execution View (see example in Figure 9-1.)
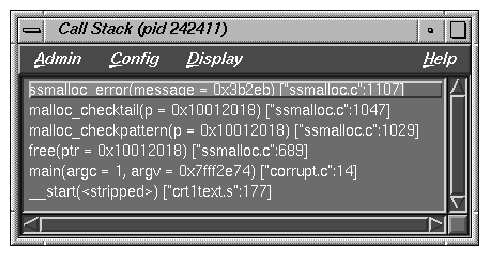
Select Views -> Call Stack from the Main View window menu bar.
Call Stack opens displaying the call stack frame at the time of the error (see Figure 9-2).
Click the Continue button in the Main View window's control panel. Watch the Execution View and Call Stack windows.
The process continues from the stop at the boundary overrun warning until it hits the next trap where an erroneous free error occurs.
Click the Continue button again and watch the Execution View and Call Stack windows.
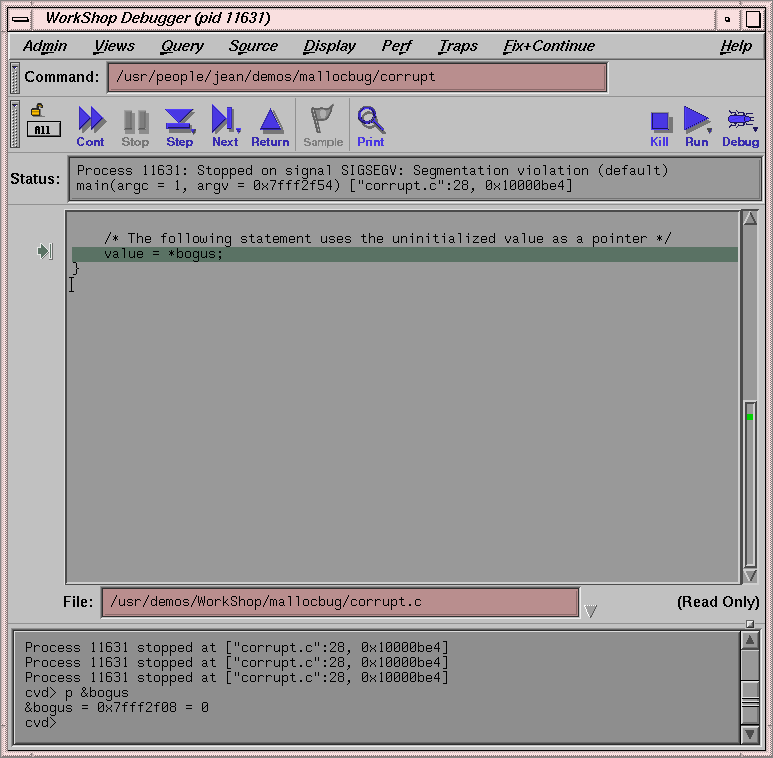
This time the process stops at a bus error or segmentation violation. The PC stops at the following statement because bogus was set to an uninitialized value:
value=*bogus
Enter p &bogus on the Debugger command line at the bottom of the Main View window.
This gives us the address for the bogus variable and has been done in Figure 9-3. We need the bad address so that we can set a watchpoint to find out when it is written to.
Deactivate the stop trap by clicking the toggle button next to the trap description in the Trap Manager window, and click the Kill button in the Main View window to kill the process.
Click on the Clear button in the Trap Manager window.
Type the following command in the Trap field. This includes the address you obtained from the Debugger command line (see Figure 9-3). This sets a watchpoint that is triggered if a write is attempted at that address.

Note: Use the address from your system, not the one shown here.
stop watch address 0x7fffaef4 for write
Click the Add button.
Click the Run button and observe the Main View window.
The process stops at the point where the bogus variable receives a bad value. Details of the error display in the Main View window's Status field.